Chapter #22: System Monitoring, Logging, and Troubleshooting
Learn essential tools and techniques for monitoring system health, analyzing logs, and diagnosing common Ubuntu problems.

In the previous chapter, we covered Ubuntu Server installation, SSH configuration with key authentication, and security best practices for remote server administration.
Now we shift our focus to system monitoring and troubleshooting, which are much-needed skills that will help you maintain healthy servers and quickly resolve issues when they arise.
Whether you're running Ubuntu on your desktop or managing production servers, knowing how to monitor system resources, analyze logs, and diagnose problems systematically will save you countless hours of frustration and help you prevent small issues from becoming major outages.
Learning these monitoring and troubleshooting techniques helps you understand what's happening inside your system at any given moment and gives you the diagnostic skills needed to identify and fix problems efficiently.
Here's what we'll cover:
- System Resource Monitoring - tracking CPU, memory, and process usage with htop.
- Log Management and Analysis - finding and interpreting system logs with journalctl.
- Disk and Storage Monitoring - checking disk space and identifying I/O bottlenecks.
- Network Troubleshooting - diagnosing connectivity issues and checking active connections.
- Systematic Troubleshooting Approach - a practical methodology for solving problems efficiently.
By the end of this chapter, you'll be able to monitor your Ubuntu system's health, quickly locate relevant information in system logs, and diagnose common problems using a structured approach.
System Resource Monitoring with htop
Understanding how your system uses resources like CPU, memory, and disk forms the foundation of keeping your Ubuntu installation running smoothly.
While Ubuntu includes the basic top command for monitoring processes, htop provides a much more user-friendly interface with color-coding, easy navigation, and interactive process management.
Installing and Launching htop
First, update the system packages, then install htop and launch it by typing htop in the terminal, and you’ll see a colorful, real-time display of your system’s CPU, memory, and running processes.
sudo apt update
sudo apt install htop
htop
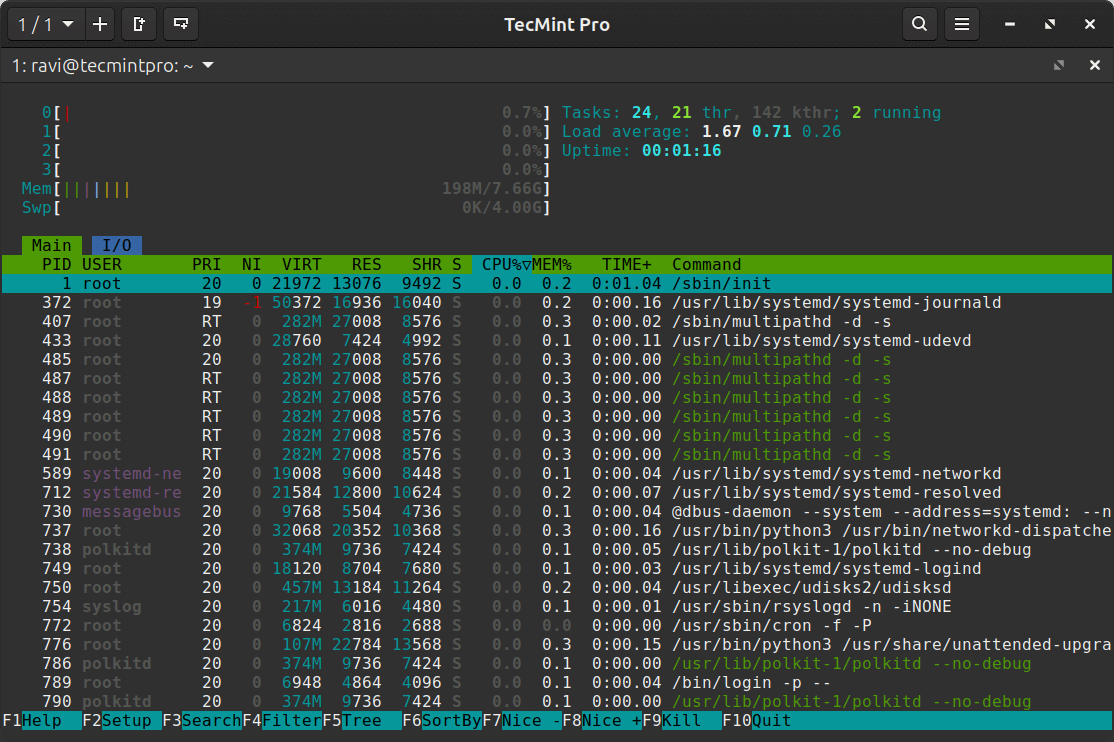
The htop screen divides into several sections that provide different types of information.
At the top, you'll see color-coded bars representing each CPU core, showing how busy each processor is at any moment.
Green indicates normal priority processes, blue shows low-priority processes, and red represents kernel processes.
Below the CPU bars, the memory usage appears as two bars: one for physical RAM and another for swap space.
The memory bar uses green for used memory, blue for buffers, and yellow for cache.
The main area displays a scrollable list of all running processes, showing:
- PID - Process ID number
- USER - Which user owns the process
- PRI - Priority level
- NI - Nice value (affects scheduling)
- VIRT - Virtual memory used
- RES - Actual physical memory used
- SHR - Shared memory
- S - Process state (R=running, S=sleeping, Z=zombie)
- CPU% - CPU usage percentage
- MEM% - Memory usage percentage
- TIME+ - Total CPU time used
- Command - The command or program name
When you notice your system slowing down, htop immediately shows you which process is consuming resources - whether it's a runaway browser tab, a background update, or a misbehaving service.