Chapter #17: Advanced Ubuntu Administration
In this chapter, you'll learn professional system administration skills, including system monitoring, performance tuning, process management with systemd, log analysis, task automation, and comprehensive backup strategies to keep your Ubuntu system running.

In the previous chapter, we explored virtualization and containers, learning how to run multiple isolated systems on a single machine.
Now we're going to dive deep into system administration - the skills that keep servers running smoothly, prevent problems before they occur, and quickly recover when things go wrong.
System administration is about keeping your Linux system healthy and running smoothly, which means monitoring resources, diagnosing problems through logs, optimizing performance, automating routine tasks, and maintaining reliable backups.
These system administration skills apply whether you're managing your personal Ubuntu desktop, administering company servers, or working in IT operations. They're valuable because they help you keep systems reliable and running smoothly under real-world conditions.
In this chapter, we'll explore the essential practices of system administration:
- System Monitoring - tracking resource usage and identifying bottlenecks before they impact performance.
- Performance Tuning - optimizing system speed and responsiveness based on what you observe.
- Systemd Fundamentals - understanding how Ubuntu's service manager orchestrates the system.
- Log Management - finding problems in system logs.
- Task Automation - scheduling recurring jobs with cron and systemd timers.
- Backup Strategies - protecting your data and planning for recovery when things go wrong.
By the end of this chapter, you'll have professional-level system administration skills that apply across different Linux environments and real-world scenarios.
System Monitoring and Performance Analysis
Effective system administration starts with understanding what your system is actually doing at any given moment.
In this section, we'll explore the monitoring tools that help you observe your system in real-time, starting with the basics and progressing to more advanced options.
We'll begin with top and htop, two essential utilities for watching your system's vital signs as they happen.
Using top for Real-Time System Monitoring
The top command provides a continuously updating view of your system's activity, where you can see which processes are running, how much CPU and memory they're consuming, and watch these numbers change in real-time as your system works.
top
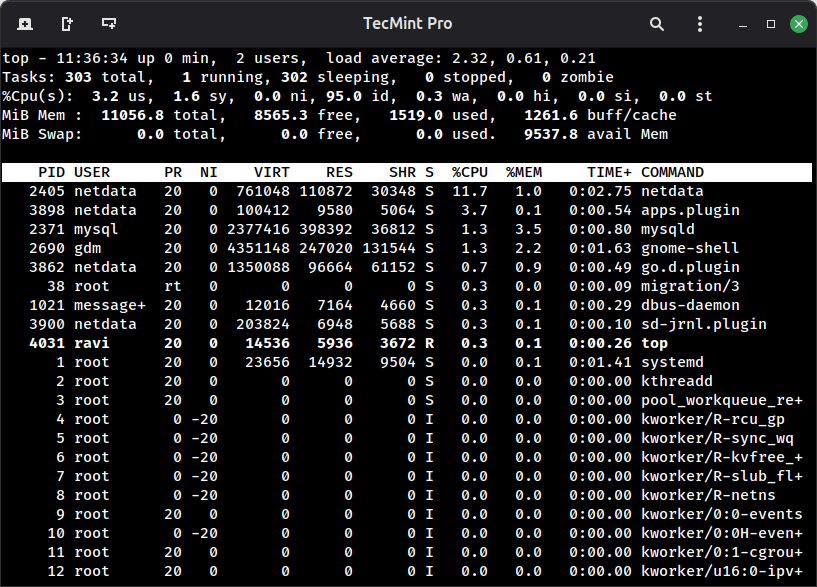
top CommandLet me walk you through what you're seeing in the top output, as understanding these numbers helps you diagnose what's happening on your system.
The summary area at the top tells you about overall system health:
The load average shows three numbers: 2.32, 0.61, 0.21, these represent the average system load over 1, 5, and 15 minutes respectively.
On a system with multiple CPU cores, you'd compare these numbers to your core count – a load of 2.0 on a 4-core system means you're running at about 50% capacity.
The CPU line breaks down what your processor is doing. You'll see us (user space - your applications), sy (system/kernel operations), id (idle time), and wa (waiting for I/O).
In this screenshot, the system is 95% idle, which indicates plenty of available CPU capacity. If you see high wa values, which typically point to disk bottlenecks rather than CPU limitations.
The memory lines show your RAM situation, where you have total memory, what's currently used, what's free, and what's used for buffers and cache.
That buffer/cache memory is interesting because Linux uses it to speed up file access, but it can be reclaimed instantly when applications need it.
The "avail Mem" value tells you how much memory is actually available for new programs.
The process list below shows individual programs:
Each line represents a running process, and the PID is the unique process identifier, %CPU shows how much processor time it's consuming, and %MEM indicates its share of RAM.
The TIME+ column accumulates total CPU time since the process started. In this example, you can see netdata and several system processes are running, with most showing minimal resource usage.
Some useful keyboard shortcuts while top is running:
Press M to sort processes by memory usage, or P to sort by CPU usage - this quickly reveals which programs are consuming the most resources.
Press 1 to see individual CPU cores broken out separately, which helps on multi-core systems. Press k to kill a process by entering its PID, and q to quit top when you're done.
What makes top particularly valuable is that it updates continuously, so you can watch resource usage change in real-time as your system responds to different workloads.