Chapter 26: Investigate Linux Performance Issues Using Claude Code
In this chapter, you'll use Claude Code as a co-pilot for performance investigations, tracing high load average through CPU, memory, and disk I/O to find the actual bottleneck.
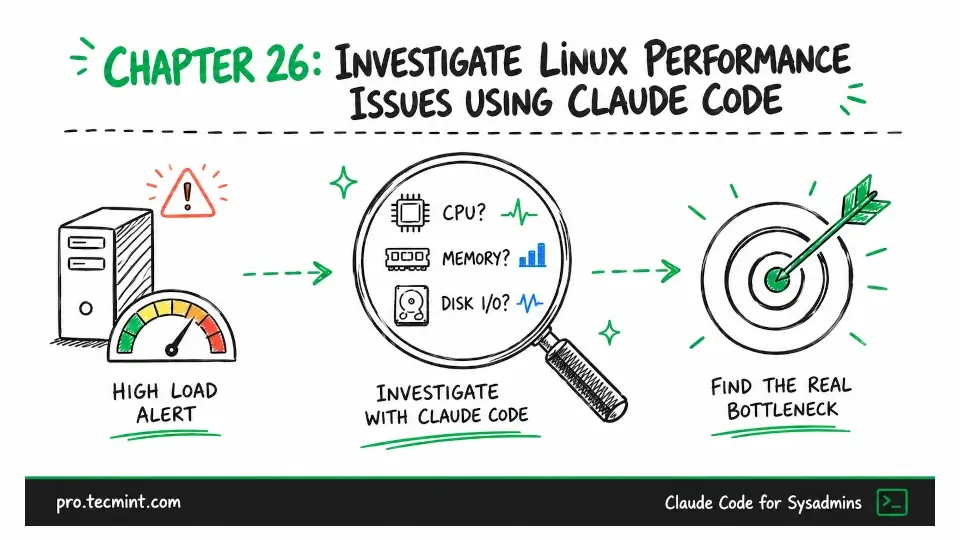
In the previous chapter, we learned how to write postmortems and rebuild incident timelines from logs, and now, we'll move on to the third part of Module 7: performance investigation.
A high load average is one of the most common and most frequently mishandled alerts in Linux system administration, because the number alone provides very little information.
A load average of 8.0 on a 32-core server represents a relatively light workload, while a load average of 4.0 on a 2-core server indicates a system under significant pressure.
The important question is not the value itself, but what is causing it. Answering that question requires following a structured diagnostic process that many administrators understand in theory but often shortcut when responding to production incidents.
Claude Code is valuable in this process not because it understands your system better than you do, but because it can analyze the output from multiple performance tools at the same time while preserving the diagnostic sequence.
It correlates information from commands such as top, vmstat, and iostat, identifies how their results relate to one another, and recommends the next logical step in the investigation.
Rather than treating each command as an isolated source of information, it helps build a complete picture of the system's behavior.
By the end of this chapter, you'll be able to interpret load average correctly, distinguish between normal and abnormal system behavior, and follow a repeatable troubleshooting workflow that helps you quickly identify the root cause of performance problems in production Linux servers.