Chapter 23: Build a Custom MCP Server for Linux Monitoring
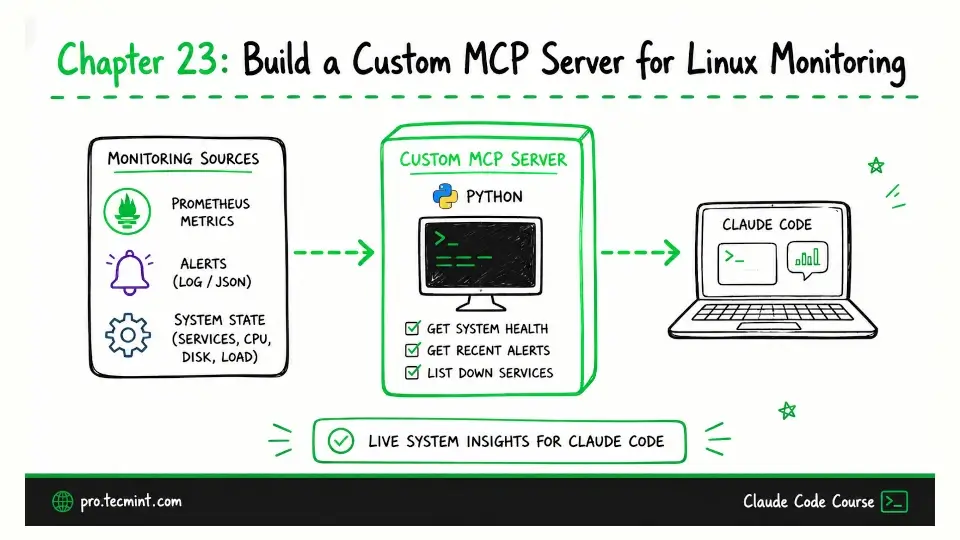
In this chapter, you'll connect Claude Code to Prometheus using an existing MCP server, then build a simple custom MCP server in Python for your own monitoring stack.
In the previous chapter, you learned how to connect Claude Code to internal documentation using the filesystem, Notion, and Confluence MCP servers.
Those integrations allowed Claude to retrieve information from static documentation and knowledge bases. While this is useful for answering configuration and operational questions, it does not provide visibility into the current state of your systems.
In this chapter, you will extend that same integration model to your monitoring infrastructure. Instead of relying on command output that you copy and paste into a conversation, Claude will be able to query live metrics directly from your monitoring stack.
This chapter explores two approaches.
- The first is connecting an existing Prometheus MCP server that requires only a few minutes to configure and immediately gives Claude access to metrics from any Prometheus-compatible monitoring environment.
- The second approach is building a minimal MCP server from scratch in Python that is useful when your monitoring platform does not already have an MCP server or when you need to expose custom data that existing integrations do not support.
Although these approaches differ in implementation, they follow the same integration pattern within Claude Code.
Once you understand how Claude communicates with one MCP server, you can apply the same principles to virtually any service that exposes data through the Model Context Protocol.
Refresh sudo Credentials
Before making any changes, refresh your sudo session so you won't be interrupted by password prompts while working.
sudo -v
Output:
[sudo] password for ravi: