3 Modern Terminal Tools to Monitor Linux Server Logs
Learn how to use lnav, tmux with journalctl, and LazyTail on Linux to follow, filter, and query server logs directly from the terminal without repeatedly grepping through raw log files.
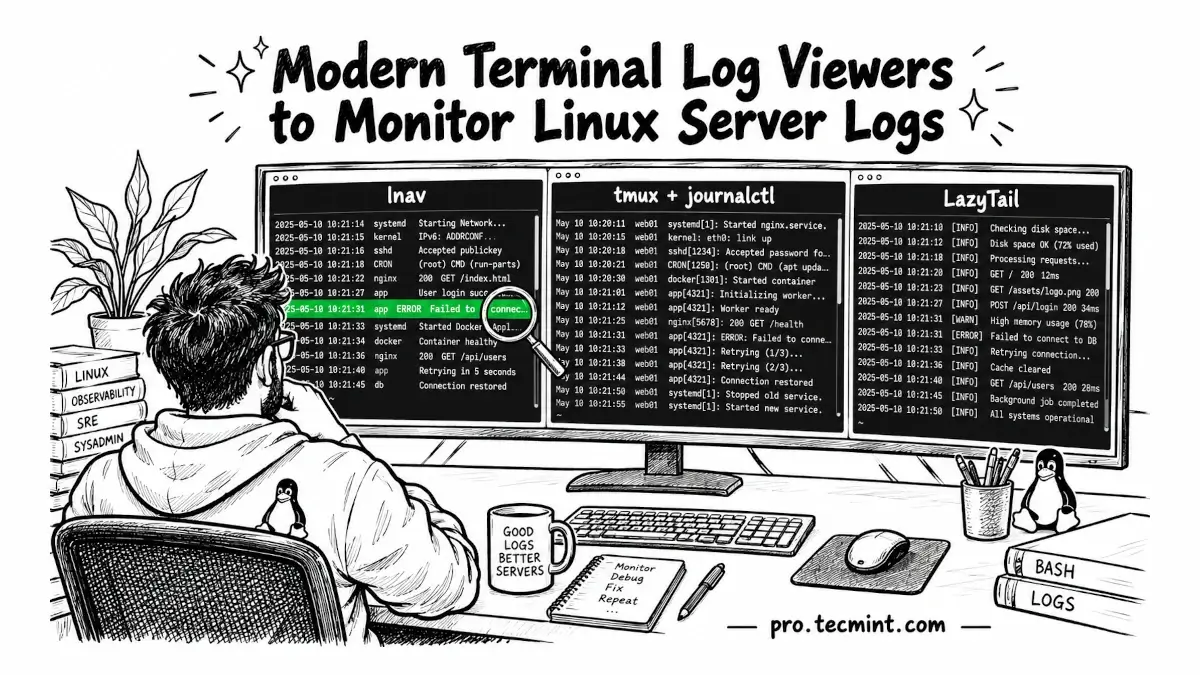
Switching between tail -f, less, and grep across several log files can quickly become frustrating, especially when a server is already having problems.
Instead of jumping between multiple terminals, we can use tools such as lnav, a tmux dashboard built around journalctl, and LazyTail to read, filter, and query logs from one terminal.
For example, imagine Nginx starts returning 502 errors on a production server late in the evening. You open one SSH session to follow /var/log/nginx/error.log, another to watch the PHP-FPM service with journalctl -u php-fpm, and a third for the Nginx access log.
At that point, you are constantly switching between windows and trying to match timestamps manually to understand what happened.
The traditional Linux commands still work well, but they usually focus on one file or stream at a time, and commands such as tail, less, and grep also treat log entries as plain text.
So they do not automatically understand log levels, merge events from different files by timestamp, or summarize repeated entries unless you build additional pipelines with tools such as awk, sort, and uniq.
In this guide, we will look at three tools that remove most of that friction.
- lnav (the Logfile Navigator) understands log formats and lets you query them with SQL.
- A tmux session built around journalctl turns several systemd journal streams into one live dashboard.
- LazyTail is a newer Rust viewer with live filtering, tabs, and a query language for JSON and logfmt logs.