How to Set Up Real-Time Squid Proxy Analytics with GoAccess on Linux
In this article, set up GoAccess on Linux to parse Squid's access.log and show live client, domain, and bandwidth stats in a browser dashboard.

Squid records every request that passes through the proxy in access.log, but reading raw epoch timestamps won't tell you which client is using most of your bandwidth. Here's how to load that log into GoAccess and view it as a live dashboard behind Nginx.
If you run a Squid proxy for an office, a lab, or a group of build servers, sooner or later someone asks why the internet is slow, and the honest answer is usually "let me check the logs".
That check normally means running tail -f on /var/log/squid/access.log, squinting at Unix timestamps, and piping things through awk and sort until a pattern appears.
Tools such as SARG and Calamaris can turn Squid logs into reports, but they generate them in batches, so you only find out about a bandwidth hog after the damage is done.
What you really want is a view that updates while the traffic is happening, so you can see the busy client, the heavy domain, and the denied requests as they arrive.
GoAccess fills that gap, which is a fast, open-source log analyzer written in C that parses access logs incrementally and can push its results to a self-contained HTML report over a WebSocket.
In this guide, we will point GoAccess at Squid's native log, run it as a hardened systemd service, and serve the live dashboard through Nginx so only the admin workstation can see it.
How GoAccess Parses Squid's Log
Before installing anything, it helps to understand how the pieces pass data to each other, because almost every problem in this setup comes from one of those hand-offs breaking.
Squid writes one line to access.log for every request it handles, and GoAccess follows that file, parses each new line as it appears, and keeps its counters in an on-disk database so the numbers survive a restart.
In real-time HTML mode, GoAccess writes an index.html report once and then sends updates to every open browser through its built-in WebSocket server, which listens on TCP port 7890 by default.
We don't want that WebSocket port exposed on the network, so GoAccess will bind it to 127.0.0.1 and Nginx will sit in front of it.
Nginx serves the report page on port 80 and forwards the /ws path to GoAccess, which means the browser talks to a single address and you only need to protect one service.
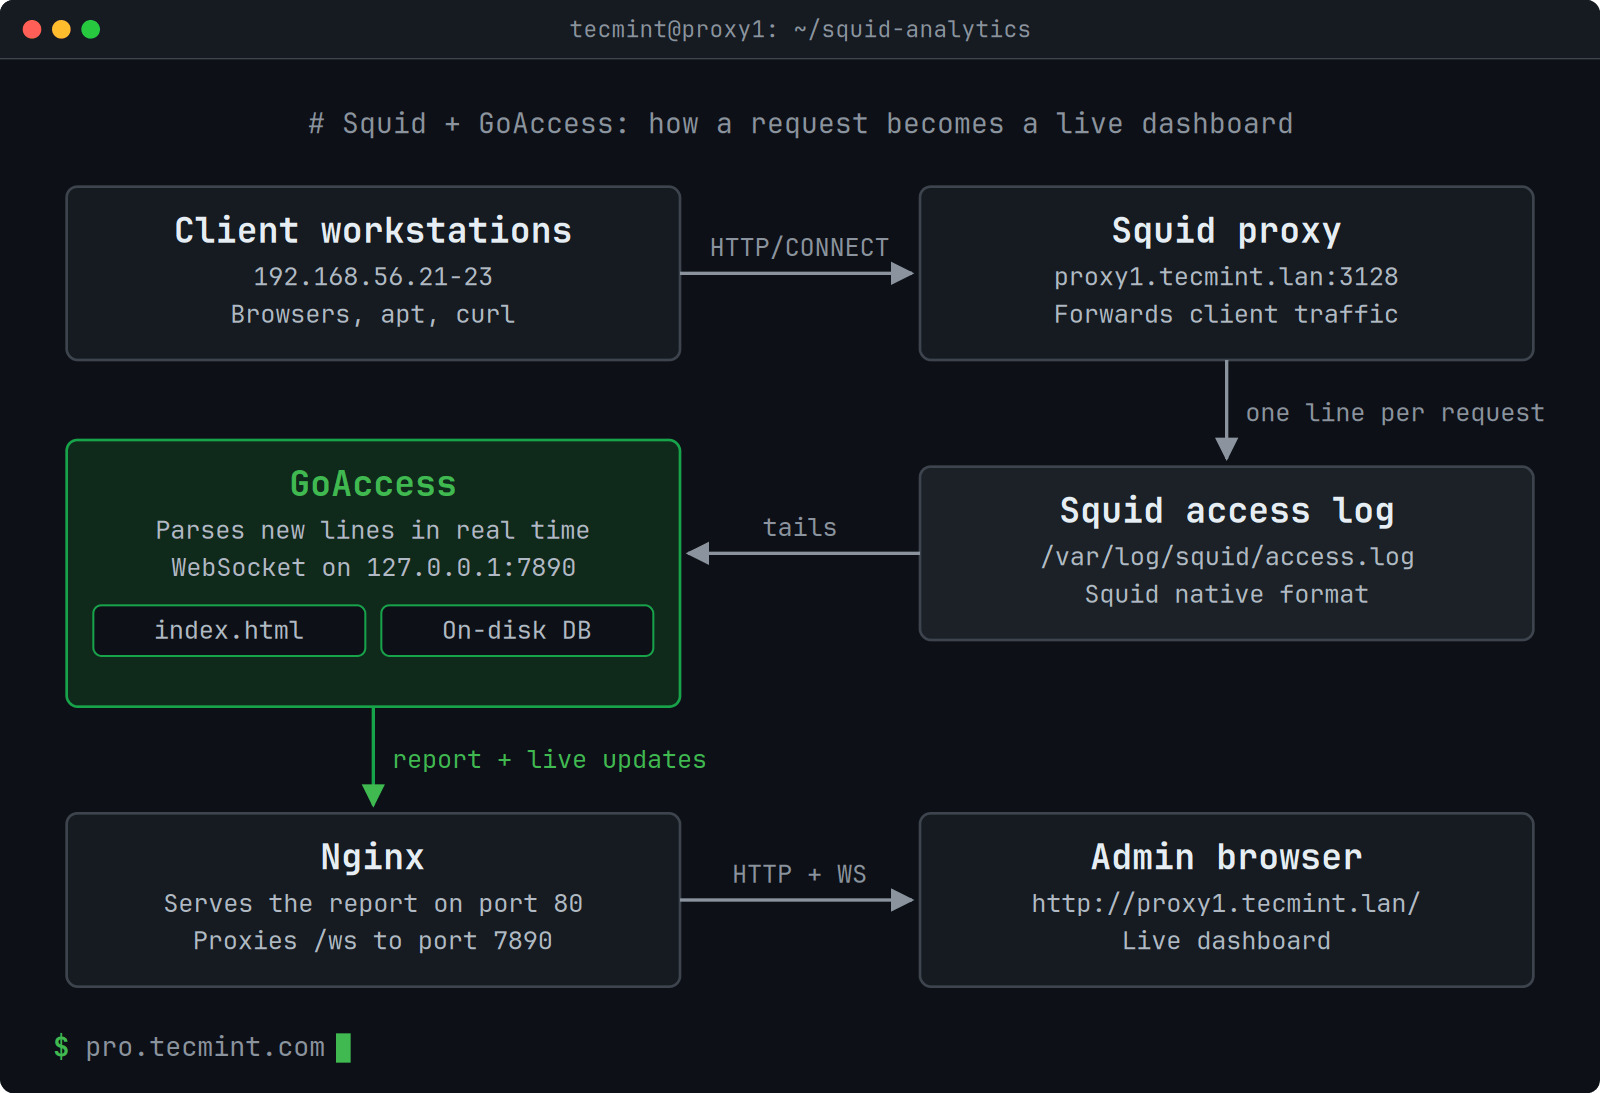
The hosts used throughout this guide are listed below.
| Hostname | IP Address | Role | Services |
|---|---|---|---|
| proxy1.tecmint.lan | 192.168.56.10 | Proxy and analytics server | Squid (3128), GoAccess (127.0.0.1:7890), Nginx (80) |
| admin workstation | 192.168.56.5 | Views the dashboard | Web browser |
| client1–client3 | 192.168.56.21–23 | Proxy users | Browsers, apt, curl |
| monitor1.tecmint.lan | 192.168.56.30 | Uptime checks through the proxy | Monitoring agent |