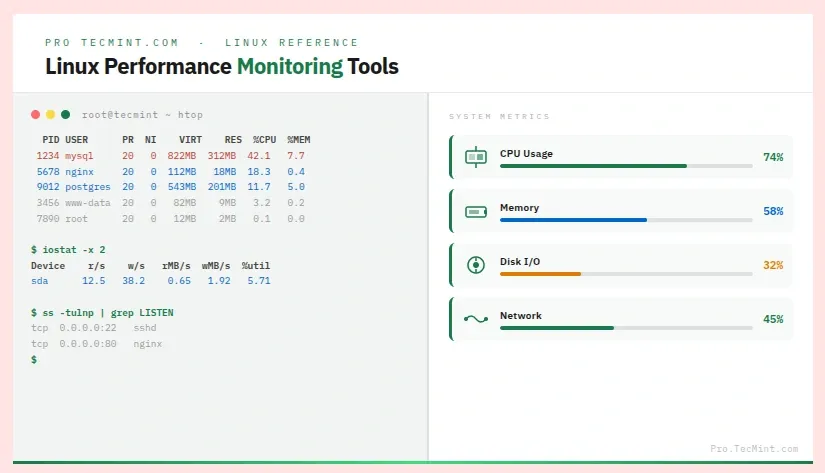
34 Linux Performance Monitoring Tools Every Sysadmin Should Know
A complete list of 34 best command-line tools to monitor Linux performance - covering CPU, memory, disk I/O, network, and security with examples and pro tips.
If you manage Linux servers, you already know that monitoring performance is part of your everyday routine.
Whether it’s a sudden CPU spike, memory running low, disk I/O going through the roof, or a network interface behaving unpredictably, you need the right tools to quickly identify and fix the problem.
Over the years, the Linux ecosystem has built up a solid collection of command-line monitoring tools.
Some come pre-installed, some need a quick apt install or dnf install, but all of them are genuinely useful once you know what each one is for.
In this article, we have put together a list of 30+ of the best command-line tools to monitor Linux performance - covering CPU, memory, disk, network, security, and more.
For each tool, we’ll walk through practical examples, highlight real use cases, and include a pro tip to help you get the most out of it.
1. top - Linux Process Monitoring
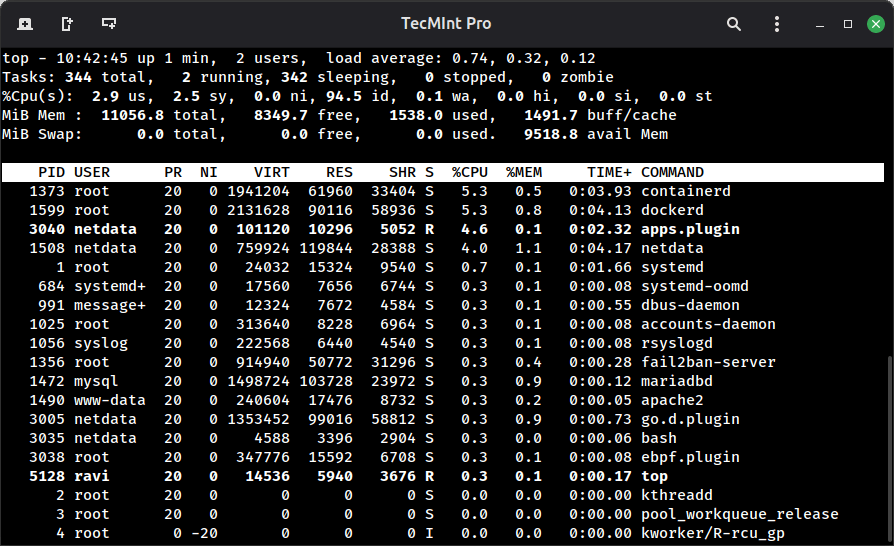
top is one of the first tools any Linux administrator learns, and for good reason, it gives you a live, continuously refreshing view of all running processes along with CPU usage, memory usage, load average, swap, and more, all in one screen.
It comes pre-installed on virtually every Linux distribution, so there is nothing to install.
When to use it: You notice the server is slow and want a quick look at which process is eating up resources, run:
# top
Here are a few more handy top command tricks to get better insights:
# top -u tecmint          # Show processes owned by a specific user
# top -p 1234,5678        # Watch specific PIDs only
# top -b -n 1 > top.txt   # Run once in batch mode and save output to a file
Useful keyboard shortcuts inside the top:
| Key | Action |
|---|---|
M |
Sort by memory usage |
P |
Sort by CPU usage |
k |
Kill a process by PID |
q |
Quit |
1 inside top to expand the CPU line and see individual usage for each core. Very useful on multi-core servers when you suspect one core is being maxed out.2. vmstat - Virtual Memory Statistics
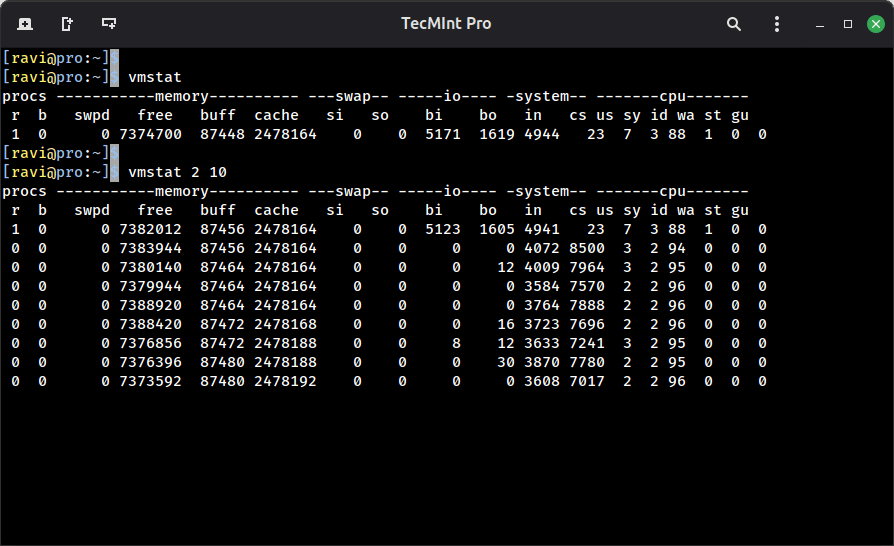
vmstat is a lightweight tool that gives you a quick snapshot of what is happening with memory, swap, CPU, and disk I/O.
You can also run it in interval mode to watch stats update over time, which is more useful than a single snapshot.
It is part of the sysstat package, so install that first if vmstat is not available on your system.
sudo dnf install sysstat      [On RHEL/CentOS/Fedora/Rocky Linux & AlmaLinux]
sudo apt-get install sysstat  [On Debian/Ubuntu & Mint]
sudo pacman -S sysstat        [On Arch Linux]
When to use it: The server feels sluggish, and you want to check if it is a memory problem, a swap issue, or an I/O wait causing it.
vmstat              # One-time snapshot
vmstat 2 10         # Update every 2 seconds, 10 times
vmstat -s           # Show memory stats in a summary table
vmstat -d           # Show disk statistics
wa column (I/O wait). If it is consistently above 10-15%, your bottleneck is disk I/O, not CPU or memory.