20+ Linux Disk I/O Monitoring Tools You Should Know
In this article, we cover 20+ Linux tools to monitor, analyze, and optimize disk I/O, from essential checks to advanced tracing and diagnostics.

When your Linux system starts slowing down, the root cause is often disk I/O (input/output) rather than CPU or memory.
Even with sufficient processing power and RAM, slow or overloaded storage can bring the entire system to a standstill.
Linux provides a wide range of tools to help you understand what is happening at the storage layer.
Monitoring disk I/O is not about running a single command; different tools provide different perspectives.
Some give a high-level view of overall disk activity, others focus on per-process usage, and more advanced tools allow you to trace individual I/O operations in detail.
In this guide, we’ll explore over 20 tools to monitor, analyze, and optimize disk I/O on Linux, starting with essential tools and moving into advanced techniques such as block-level tracing, disk diagnostics, and filesystem-specific monitoring.
By the end, you’ll have a clear understanding of how to identify performance bottlenecks and keep your Linux system running efficiently.
Let me break this down for you.
Essential I/O Monitoring Tools
These are the core tools for monitoring disk performance on Linux, and if you are new to I/O troubleshooting, start here before moving on to advanced diagnostics.
1. iostat - Shows Device Input and Output Statistics
iostat is one of the many terminal-based system monitoring utilities in the sysstat package, which is a widely used tool that reports CPU statistics as well as I/O statistics for block devices and partitions.
To use iostat on your Linux system, you first need to install the sysstat package:
sudo apt install sysstat      # Debian/Ubuntu
sudo yum install sysstat      # RHEL/CentOS
After installing iostat, you can use it to check your disk activity by running it with the -x option every 2 seconds, repeating this 5 times.
iostat -x 2 5
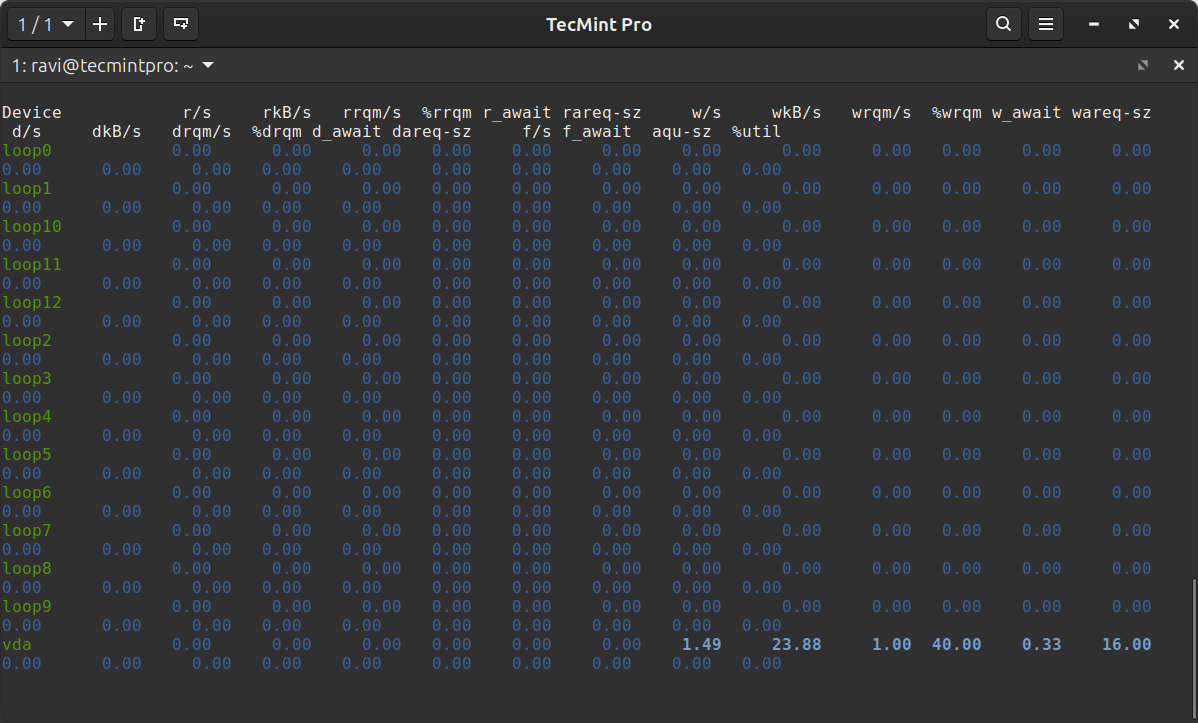
Some key metrics to watch are:
- %iowait - CPU time spent waiting for I/O.
- r/s and w/s - Number of read and write operations per second.
- rkB/s and wkB/s - Kilobytes read from and written to the device per second.
- await - Average time in milliseconds for I/O requests to be completed.
- %util - Percentage of time the device was busy handling I/O requests.
Among these, %util is particularly important because if it consistently stays above 80-90%, your disk may be struggling to keep up.
2. sar - Show Linux System Activity
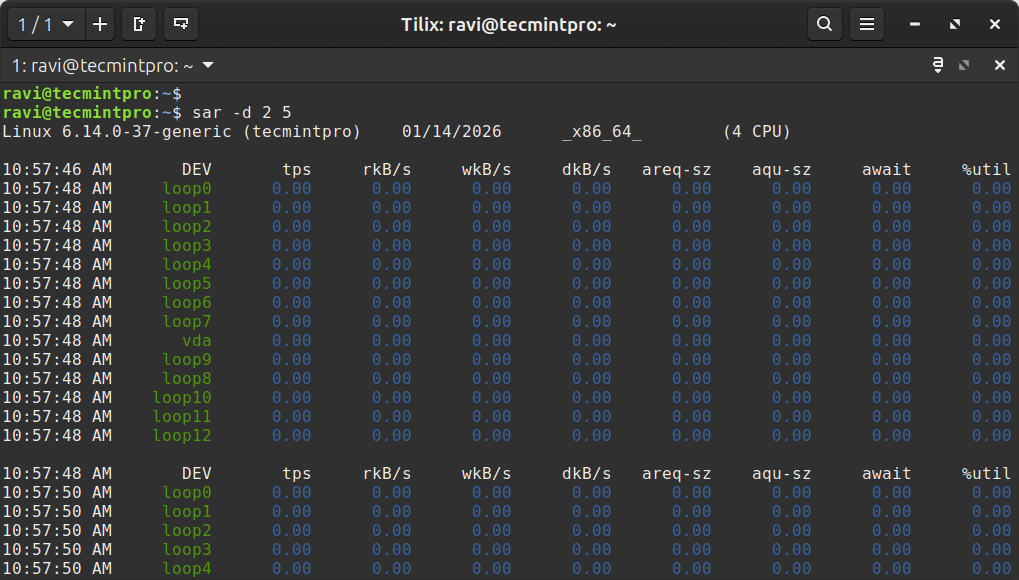
sar is another terminal-based utility included in the sysstat package that can be thought of as a more comprehensive alternative to iostat, as it collects and reports overall system activity, including CPU usage, memory, and disk I/O.
To monitor disk I/O activity in real-time, run the following command, which displays disk statistics every 2 seconds, repeated 5 times.
sar -d 2 5
You can also check historical disk I/O data with the following command, which will read disk activity data from a specific day (the 10th of the month in this example).
sar -d -f /var/log/sysstat/sa10
3. iotop - Monitor Linux Disk I/O Usage by Process
While iostat shows which disks are busy, iotop shows which processes are using the disk; it works like the top command, but instead of CPU usage, it focuses on disk I/O activity.
sudo apt install iotop      # Debian / Ubuntu
sudo yum install iotop      # RHEL / CentOS
After installing iotop, you can use the -o option to display only processes that are actively performing disk I/O, which helps reduce noise and makes issues easier to spot.
sudo iotop -o
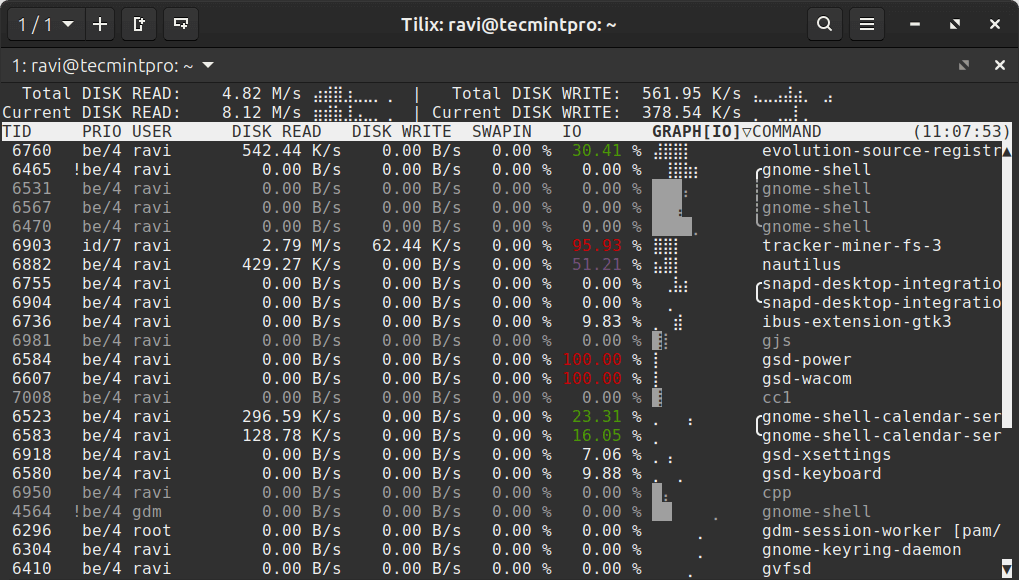
With iotop, you can see:
- Which process is reading from or writing to the disk?
- How much data each process is transferring.
- How much time do processes spend waiting for disk I/O?
This tool is often the first place to look when you need to answer the question: “What is causing high disk I/O right now?”