How to Monitor Nginx Performance with Prometheus and Grafana on RHEL 10
In this chapter, we'll monitor Nginx performance with Prometheus and Grafana on RHEL 10 (compatible with Rocky Linux and AlmaLinux).

If you're running Nginx in production, you need to know what's happening inside it. For example, is Nginx handling traffic smoothly? Are response times creeping up? Is there a sudden spike in server utilization?
Without monitoring these metrics, you won't know until something breaks like when your site slows to a crawl during peak traffic, or when you're troubleshooting why certain endpoints are timing out.
This is where Prometheus and Grafana come in. Prometheus collects metrics from your Nginx server such as requests per second, active connections, response times and stores them in a time-series database.
Grafana then connects to that database and turns the data into clear, visual dashboards that show you exactly what's happening in real-time.
In this chapter, we'll set up a complete monitoring solution for Nginx on RHEL 10 (also works on Rocky Linux, AlmaLinux, and other RHEL-compatible distributions).
By the end, you'll have professional-grade dashboards showing request rates, error percentages, response time distributions, and connection statistics - everything you need to keep your web server healthy.
How These Tools Work Together
Before installing anything, let's see how these tools work together.
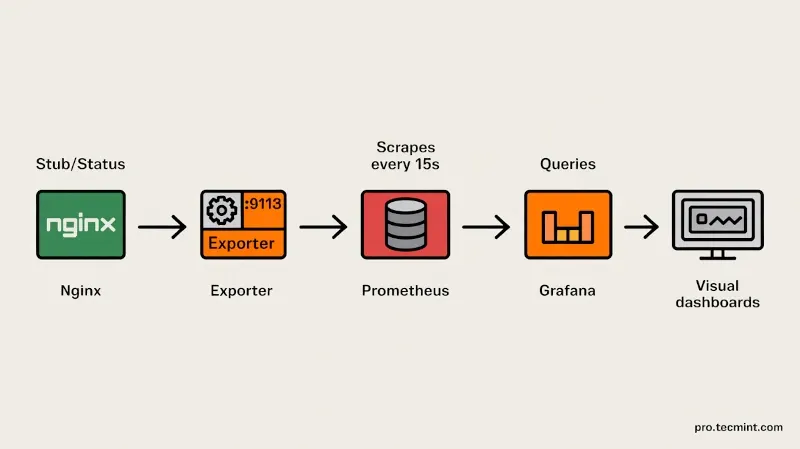
We need three things: a tool that reads Nginx statistics (the Prometheus Exporter), a database that saves those statistics over time (Prometheus), and a dashboard that turns those statistics into visual graphs you can actually understand (Grafana).
- The Nginx Prometheus Exporter reads statistics from Nginx using a built-in feature called
stub_statusthat shows basic information like active connections and total requests, then converts this data into a format Prometheus can understand and exposes it athttp://localhost:9113/metrics. - Prometheus collects these metrics every 15 seconds and stores them in its time-series database for 15 days by default, so you can look back at what happened when your site slowed down.
- Grafana connects to Prometheus, pulls this data, and displays it as visual graphs and dashboards that are much easier to understand than raw numbers.
Here's how everything connects: Nginx generates statistics → Exporter reads those statistics → Prometheus collects the data every 15 seconds → Grafana queries Prometheus → You see graphs showing what's happening with your server.
Prerequisites
You'll need RHEL 10 freshly installed with root access or sudo privileges. Your system should have at least 2GB of RAM (Prometheus and Grafana aren't heavy, but you want headroom).
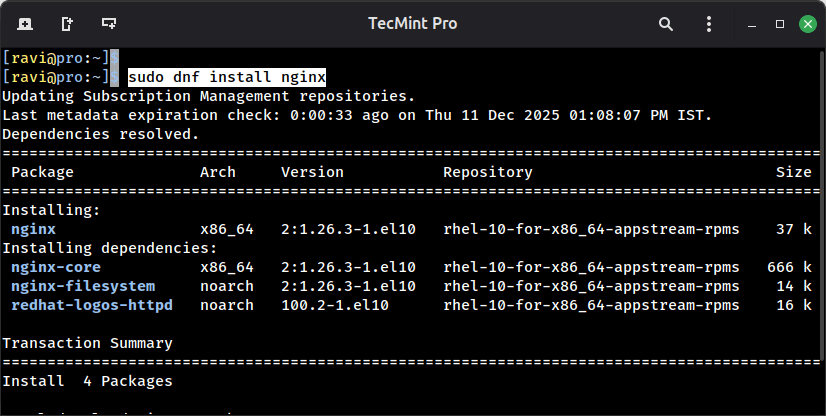
You'll also need Nginx already installed and running, if you don't have it yet, install it with the following commands.
sudo dnf install nginx
sudo systemctl start nginx
Make sure your firewall is configured to allow HTTP traffic on port 80. We'll also need to open additional ports for Prometheus (9090), Grafana (3000), and the nginx exporter (9113), but we'll handle those as we go.
One more thing: this guide assumes you're comfortable with the command line and basic text editing. We'll be using vi for editing configuration files, but you can use nano if you prefer.