Chapter #14: Monitor CPU, Processes, and Resource Limits in Linux
In this chapter, we will explore a few ways to monitor resource usage to verify the integrity and availability of critical hardware and software components in a Linux system.

Every Linux system administrator needs to know how to verify the integrity and availability of hardware, resources, and key processes. In addition, setting resource limits on a per-user basis must also be a part of his / her skill set.
In this chapter, we will explore a few ways to ensure that the system, both hardware and software, is behaving correctly to avoid potential issues that may cause unexpected production downtime and financial losses. Keep in mind that the files in /var/log are your best friends for this.
Reporting Processor Statistics
With mpstat, you can view activity for each processor individually or the system as a whole, both as a one-time snapshot or dynamically.
To use this tool, you need to install sysstat:
sudo yum install sysstat   [RHEL]
sudo apt install sysstat   [Ubuntu]
Once you have installed this tool, you can use it to generate reports of processor statistics.
To display 3 global reports of CPU utilization (-u) for all CPUs (as indicated by -P ALL) at a 2-second interval, do:
mpstat -P ALL -u 2 3
To view the same statistics for a specific CPU (CPU 0 in the following example), use.
mpstat -P 0 -u 2 3
The output of the above commands shows these columns:
- CPU: Processor number as an integer, or the word
allas an average for all processors. - %usr: Percentage of CPU utilization while running user-level applications.
- %nice: Same as
%usr, but with nice priority. - %sys: Percentage of CPU utilization that occurred while executing kernel applications. This does not include time spent dealing with interrupts or handling hardware.
- %iowait: Percentage of time when the given CPU (or all) was idle, during which there was a resource-intensive I/O operation scheduled on that CPU.
- %irq: Percentage of time spent servicing hardware interrupts.
- %soft: Same as %irq, but with software interrupts.
- %steal: Time the virtual CPU spends involuntarily waiting while the hypervisor services another virtual processor; high values indicate resource contention in virtual environments.
- %guest: Percentage of time spent running a virtual processor.
- %idle: Percentage of time when CPU(s) were not executing any tasks. If you observe a low value in this column, that is an indication of the system being placed under a heavy load. In that case, you will need to take a closer look at the process list, as we will discuss in a minute, to determine what is causing it.
mpstat shows averages since boot rather than over a specified interval. Running with intervals (like 2 3) gives real-time usage snapshots.Imposing Load and Observing Results
To impose load and observe results, do this in one terminal:
dd if=/dev/zero of=test.iso bs=1G count=1
Then, in another terminal, run:
mpstat -u -P 0 2 3
ping -f localhost   # Stop both when done (Ctrl+C)
mpstat -u -P 0 2 3
Finally, compare to the output of mpstat under “normal” circumstances:
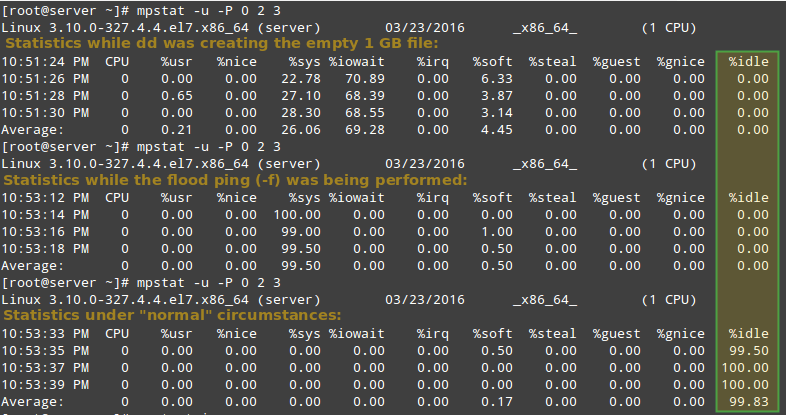
As you can see in the image above, CPU 0 was under a heavy load during the first two examples, as indicated by the %idle column.
In the next section, we will discuss how to identify these resource-hungry processes, how to obtain more information about them, and how to take appropriate action.