htop: Interactive Linux Monitor
In this article, we’ll show how to install htop, explore its interface, manage processes, and use advanced features to monitor Linux easily.

If you’ve already gotten comfortable with the top command, you’ll be glad to know that there’s a more powerful and user-friendly alternative: htop.
While top is incredibly useful for beginners, htop takes things to the next level by giving you an interactive, colorful, and easier-to-read interface for monitoring your Linux system in real-time.
With htop, you get all the features of top that includes CPU usage, memory usage, load averages, and process management, but in a much more intuitive layout. Think of htop as top’s “big brother” that makes system monitoring less overwhelming and a lot more visual.
In this article, we’ll explore:
- How to install and launch htop
- Understanding the htop interface
- Navigating and interacting with processes
- Advanced features that make htop better than top
- Practical tips for daily system monitoring
Installing htop on Linux
Unlike top, which comes pre-installed on almost all modern Linux distribution, htop is not always available by default. Fortunately, installation is simple:
Ubuntu/Debian-based distros:
sudo apt install htop
CentOS/RHEL/Fedora:
sudo dnf install htop
Arch Linux:
sudo pacman -S htop
Once installed, you can start htop by simply typing:
htop
Understanding the htop Interface
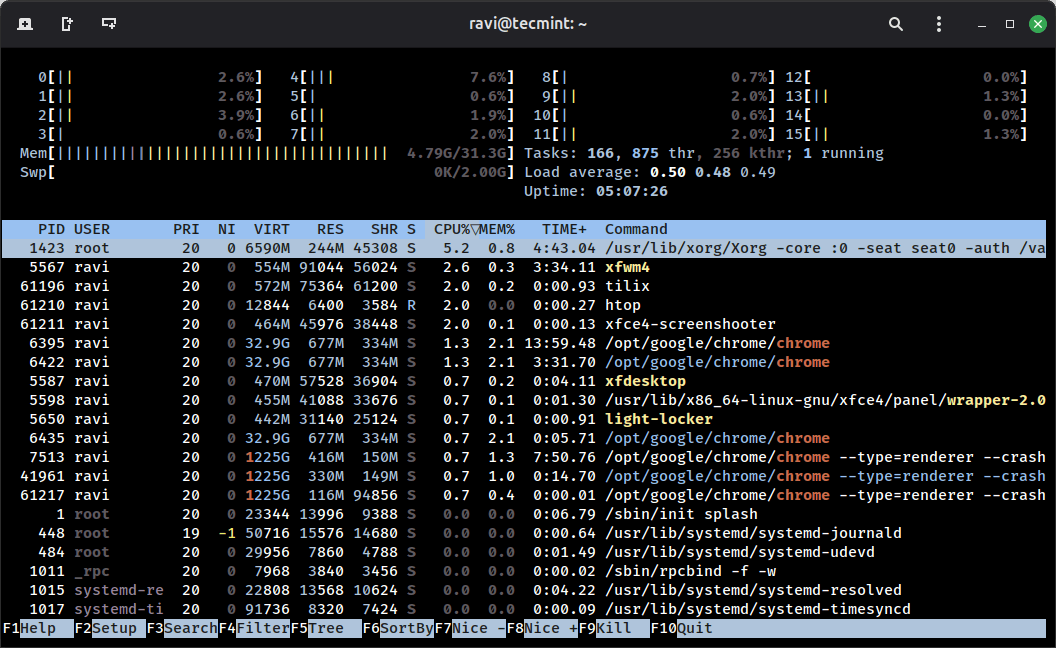
When you launch htop, you’ll immediately notice that it looks much more modern and visually appealing compared to top.
The display is divided into two main sections:
1. System Summary (Top Section)
When you launch htop, the top section is all about giving you a bird’s-eye view of your system performance. Unlike the plain text summary in top, htop uses colored bars and counters, which makes it much easier to spot issues at a glance.
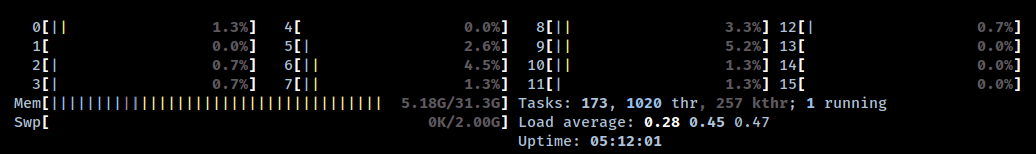
Here’s what each part in your screenshot means:
CPU Usage (Top Rows: 0-15)
- Each numbered row (
0,1,2, … up to15) represents a CPU core/thread on your system. - The percentage on the right side (e.g.,
1.3%,4.5%,5.2%) shows how much of that CPU is currently being used. - The colored bars visualize the usage type:Green → user processes (apps you run)Red → system processes (kernel tasks)Orange/Yellow → processes with adjusted priority (nice values)Blue → low-priority tasks, like waiting for I/O
Memory Usage (Mem)
This line shows how much RAM is in use versus total RAM.
5.18G / 31.3G
- 5.18 GB is currently being used.
- Out of a total of 31.3 GB available.
- The colored bar represents this usage visually. Yellow blocks show memory consumption, while blue blocks show free memory.
Swap Usage (Swp)
Swap is disk space used as “backup RAM” when physical memory runs low.
0K / 2.00G
That means no swap is being used right now, which is ideal (since using swap can slow your system down).
Tasks and Threads
This line shows how many processes and threads are running:
Tasks: 173, 1020 thr, 257 kthr; 1 running
- 173 tasks: number of total processes.
- 1020 thr: total threads across all tasks.
- 257 kthr: kernel threads.
- 1 running: only one process is actively running on the CPU at the moment, while others are idle, sleeping, or waiting.
Load Average
These numbers represent the average number of processes waiting to run over the last 1, 5, and 15 minutes.
Load average: 0.28 0.45 0.47
A good rule of thumb:
- A load value equal to the number of CPU cores means your system is fully utilized.
- You have 16 cores, and your load is way below 1 → your system is under very light load.
Uptime
This shows how long your system has been running since the last reboot.
Uptime: 05:12:01
Here, it’s been up for a little over 5 hours.