atop: Advanced Linux Monitor
In this chapter, we explore atop, a powerful Linux tool for monitoring system and process activity in real time, tracking CPU, memory, disk, and network usage, and analyzing historical logs for performance optimization.

atop is an ASCII-based full-screen performance monitor tool designed for Linux systems that provides a comprehensive overview of both system-level and process-level activity, presenting metrics in real-time while simultaneously supporting long-term logging for historical analysis.
Unlike conventional monitoring tools, atop maintains records of processes that have terminated during the monitoring interval, ensuring no data is lost for retrospective examination.
The primary purpose of atop is to facilitate detailed observation of system resource utilization and process behavior, enabling administrators to identify performance bottlenecks, optimize resource allocation, and perform trend analysis over extended periods.
It delivers continuous, structured insight into CPU, memory, swap, disk, and network usage, along with detailed per-process statistics such as CPU consumption, memory growth, disk I/O, and execution state.
Key differentiators of atop include its ability to:
- Logs terminated processes for complete activity records
- Highlights overloaded resources using a color-coded interface
- Supports optional modules, like netatop for per-process network monitoring
Through these capabilities, atop serves as a robust monitoring solution suitable for system administrators, developers, and analysts requiring both real-time visibility and comprehensive historical data in Linux-based environments.
Installation of atop in Linux
atop is supported on a wide range of Linux distributions and can be installed via standard package managers or compiled from source.
The recommended installation method is through the system’s native package repository to ensure compatibility with the kernel and dependency libraries.
For Debian and Ubuntu-based systems, installation can be performed using apt:
sudo apt update
sudo apt install atop
For Red Hat, Fedora, and CentOS-based systems, yum or dnf can be used:
sudo dnf install atop
Alternatively, the source code can be obtained from the official atop repository, followed by compilation using standard build tools (make and gcc), allowing for custom configuration options or installation on distributions lacking precompiled packages.
Logging Setup
One of atop’s most powerful features is daily logging of system and process activity for historical analysis.
- Interval-based logging: By default, atop records metrics every 10 minutes.
- Log storage: Logs are saved in
/var/log/atop/as daily files, which can later be replayed. - Configuration: Logging can be enabled or customized via
/etc/atop/atop.dailyor integrated into startup viasystemdtimers orcron. - Security considerations: Ensure proper permissions on
/var/log/atop/to prevent unauthorized access to sensitive system usage data.
These logs allow retrospective inspection of terminated processes, resource utilization trends, and performance bottlenecks.
Verification and Initial Run
After installation and configuration, atop can be launched from the terminal using the command:
sudo atop
Upon startup, the interface displays real-time system metrics and process-level activity. Verification of optional module integration (e.g., netatop, atopgpud) and logging functionality can be done by checking atop’s output and reviewing the generated log files in /var/log/atop/.
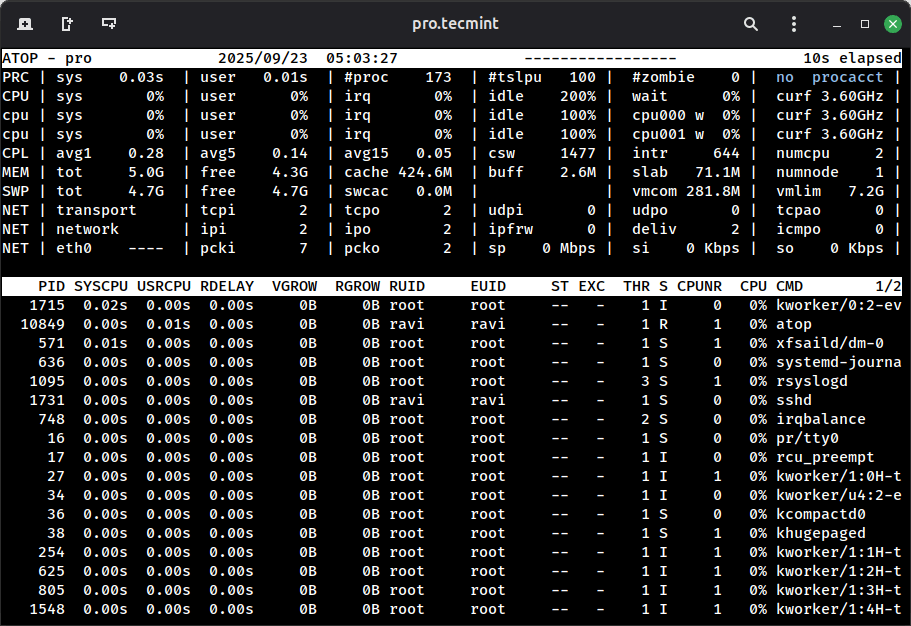
Overview of atop Interface
The atop interface is an ASCII-based, full-screen display that presents both system-level and process-level metrics in a structured, real-time format.